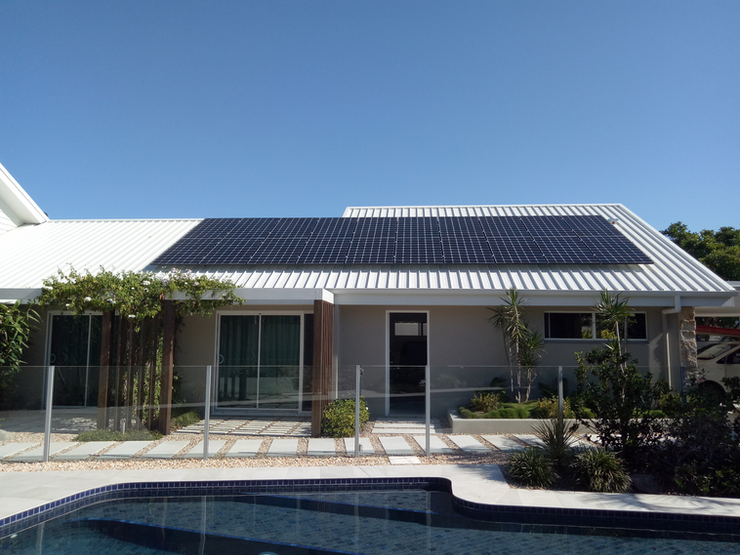
Understanding Solar ROI: How Much Can a 6.6kW System Save You?
While solar energy is excellent for cutting carbon emissions and combating climate change, the main driver for most homeowners is financial. A well-designed solar system offers impressive returns and long-term protection against rising electricity prices.
Daily Energy Output: What Can You Expect?
System output depends on factors like roof direction, tilt angle, shading, and local weather patterns.
Based on Clean Energy Council benchmarks for South East Queensland (Brisbane, Sunshine Coast, and Gympie), you can expect an average output of 4.2 kWh per day for every 1 kW of installed solar capacity.
For a popular 6.6 kW residential system, the average yield is calculated as:
Seasonal Production Trends
Summer: Longer days yield higher production, matching peak usage from air conditioners and pool pumps.
Winter: Shorter days slightly reduce generation, but clear SEQ skies maintain strong baseline performance.
Across the Sunshine Coast, the average household directly uses about 40% of the solar energy generated during daylight hours, exporting the remaining 60% back to the energy grid.
Electricity Costs Before Solar: A Sample Breakdown
To understand your savings, consider a typical South East Queensland home consuming 22 kWh per day.
Typical Costs Without Solar
Daily Energy Usage: 22kWh X $0.30/kWh = $6.60/day
Daily Supply Charge: $$1.10/day
Total Daily Cost: $7.70/day
Total Quarterly Bill: $7.70 X 91 days = $700.70/quarter
Total Annual Cost: $700.70 X 4 = $2,802.80/year
Financial Breakdown: Solar Production & Savings
When a 6.6 kW system generates around 27.7 kWh per day:
1. Direct Solar Usage (40%)
Consuming 40% of your generated power directly in your home 11.1kWh prevents buying expensive electricity from your power retailer:
2. Grid Export Credit (60%)
Sending the remaining 60% ($16.6kWh) back to the grid earns a feed-in tariff credit (average rate of ~$0.07/kWh):
3. Total Financial Benefit
Total Daily Savings: $3.33 + $1.16 = $4.49/day
Quarterly Savings: $4.49 X 91 days = $408.59/quarter
Annual Savings: $408.59 X 4 = $1,634.36/year
Estimated Electricity Bill With Solar
Quarterly Bill Before Solar: $700.70$
Quarterly Solar Savings: $408.59$
Expected Quarterly Bill With Solar: $292.11$
Payback Period and Return on Investment (ROI)
Investing in high-performance Tier-1 panels (such as REC or Trina Solar) paired with a premium inverter (such as Fronius or Sungrow) yields swift financial returns:
Estimated System Cost: ~$5,500 – $6,500 (inclusive of STC rebates)
Payback Period: Approximately 3.3 to 3.8 years
Annual Return on Investment (ROI): 25% to 30%
Choosing high-efficiency panels ensures low degradation over time, giving you long-term financial security backed by robust 25-year product and performance warranties.
Get an Accurate Quote for Your Home
Every home has unique roof angles, shading considerations, and energy requirements.
For a personalised energy yield assessment and customised quote, get in touch with SolarWide:
Phone: (07) 5309 5871
Email: sales@solarwide.com.au
Disclaimer: Calculations in this article are based on regional averages for South East Queensland and publicly available retail energy data. This information is provided for educational purposes only and does not constitute formal financial advice. Actual yield and savings depend on roof orientation, shading, retailer tariffs, and individual household consumption habits.




